Adelaide Dashboard
From Adelaide's inception, the company had assembled Looker modules to serve as dashboard views to provide direct day-to-day data to our clients. While it was able to broadly organize raw data, clients resoundingly expressed a desire for a dashboard that is faster, better organized, and goes deeper into reporting and analytics.
Working with internal stakeholders and directly with our highest-value clients, I iterated on interfaces for delivering the most vital and actionable information for our customers. In overseeing the overall design and functionality, I also project managed a team including System Architect, API Developer, React Developer, and Data Developer to make the product a reality. I further made ongoing contributions to React, D3, Laravel API, LookML, and Bash code to keep the project moving.
Through persistent testing and iterative improvements, the result is a highly performant application that vastly improves upon the functional Looker dashboard by every measure and one that clients have reacted extremely positively to.
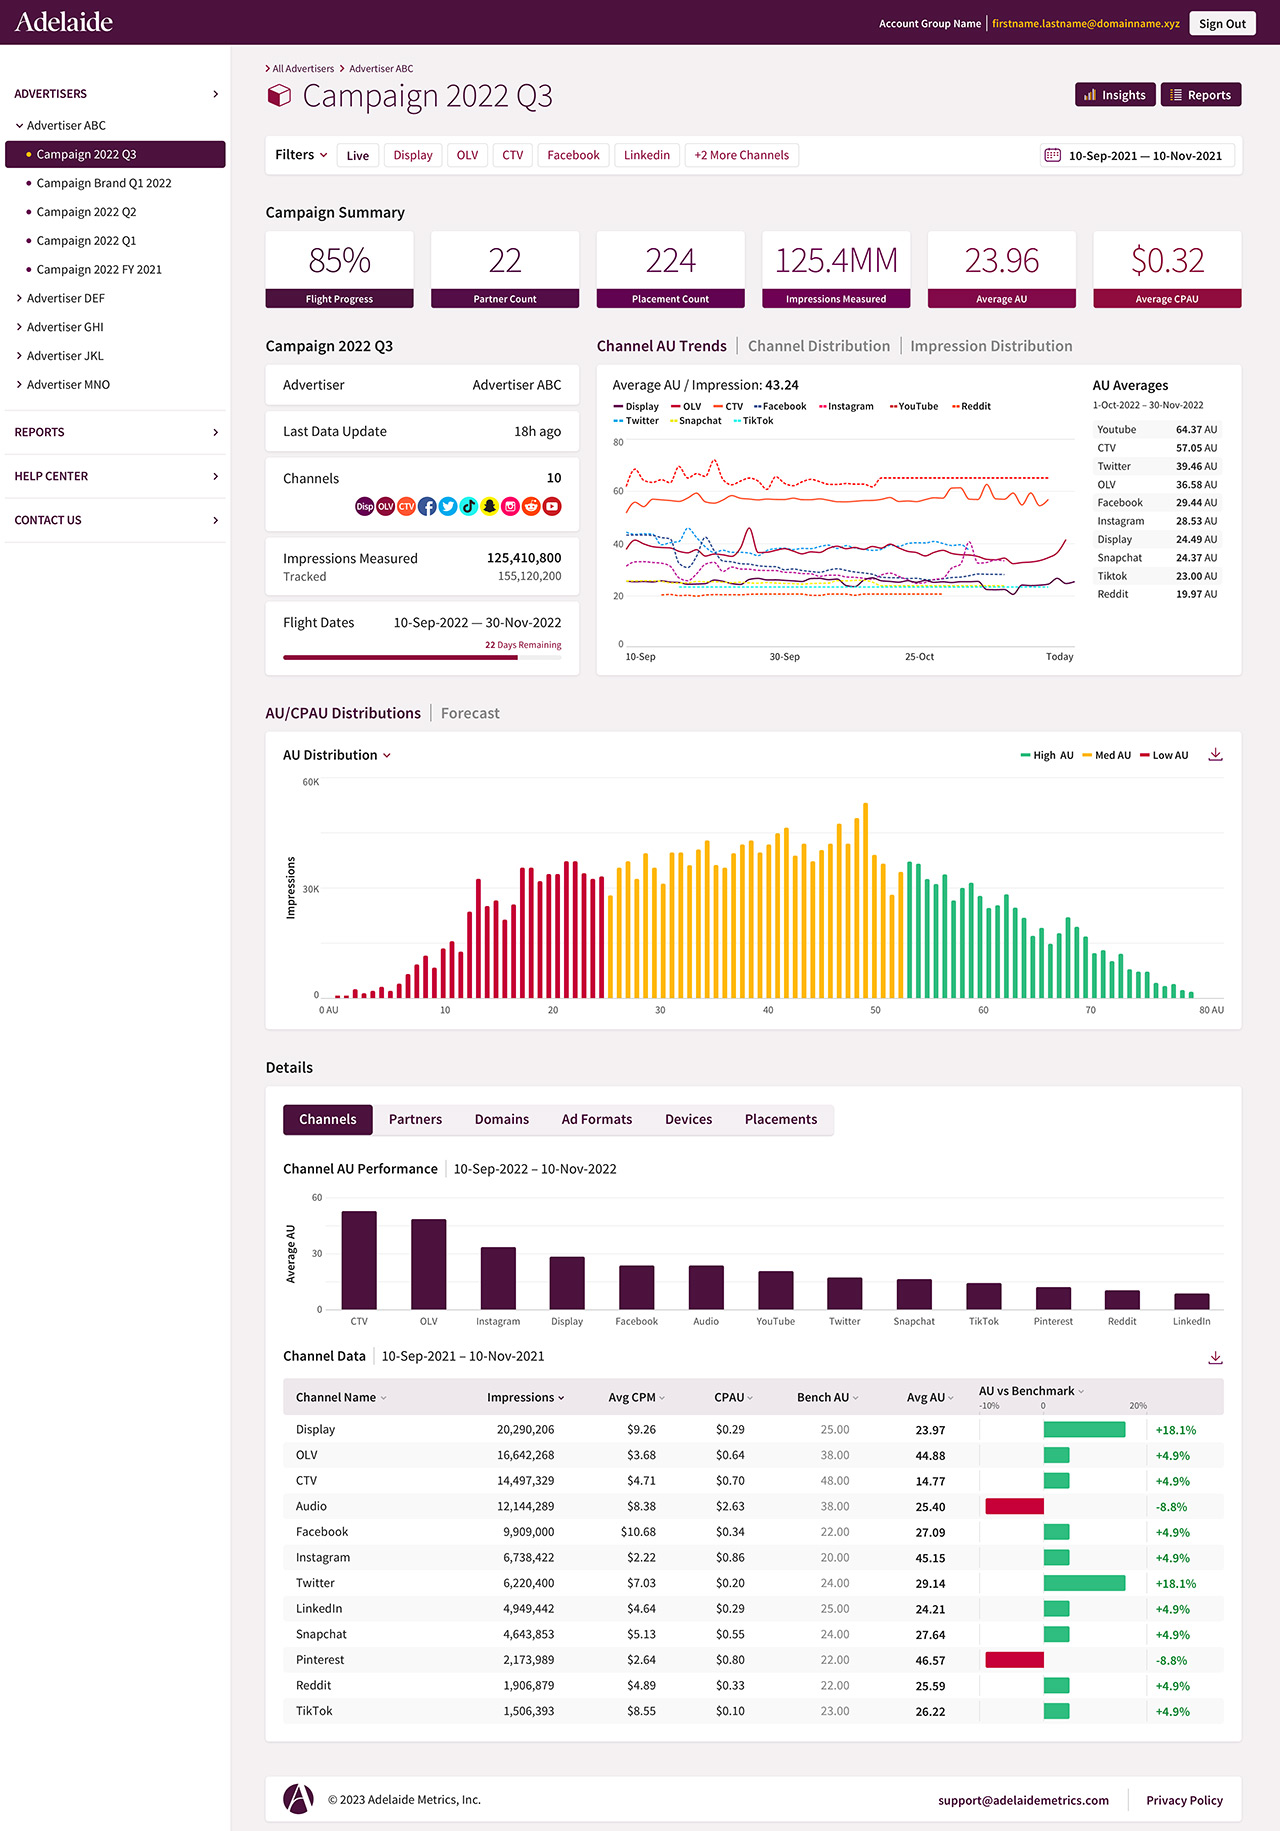
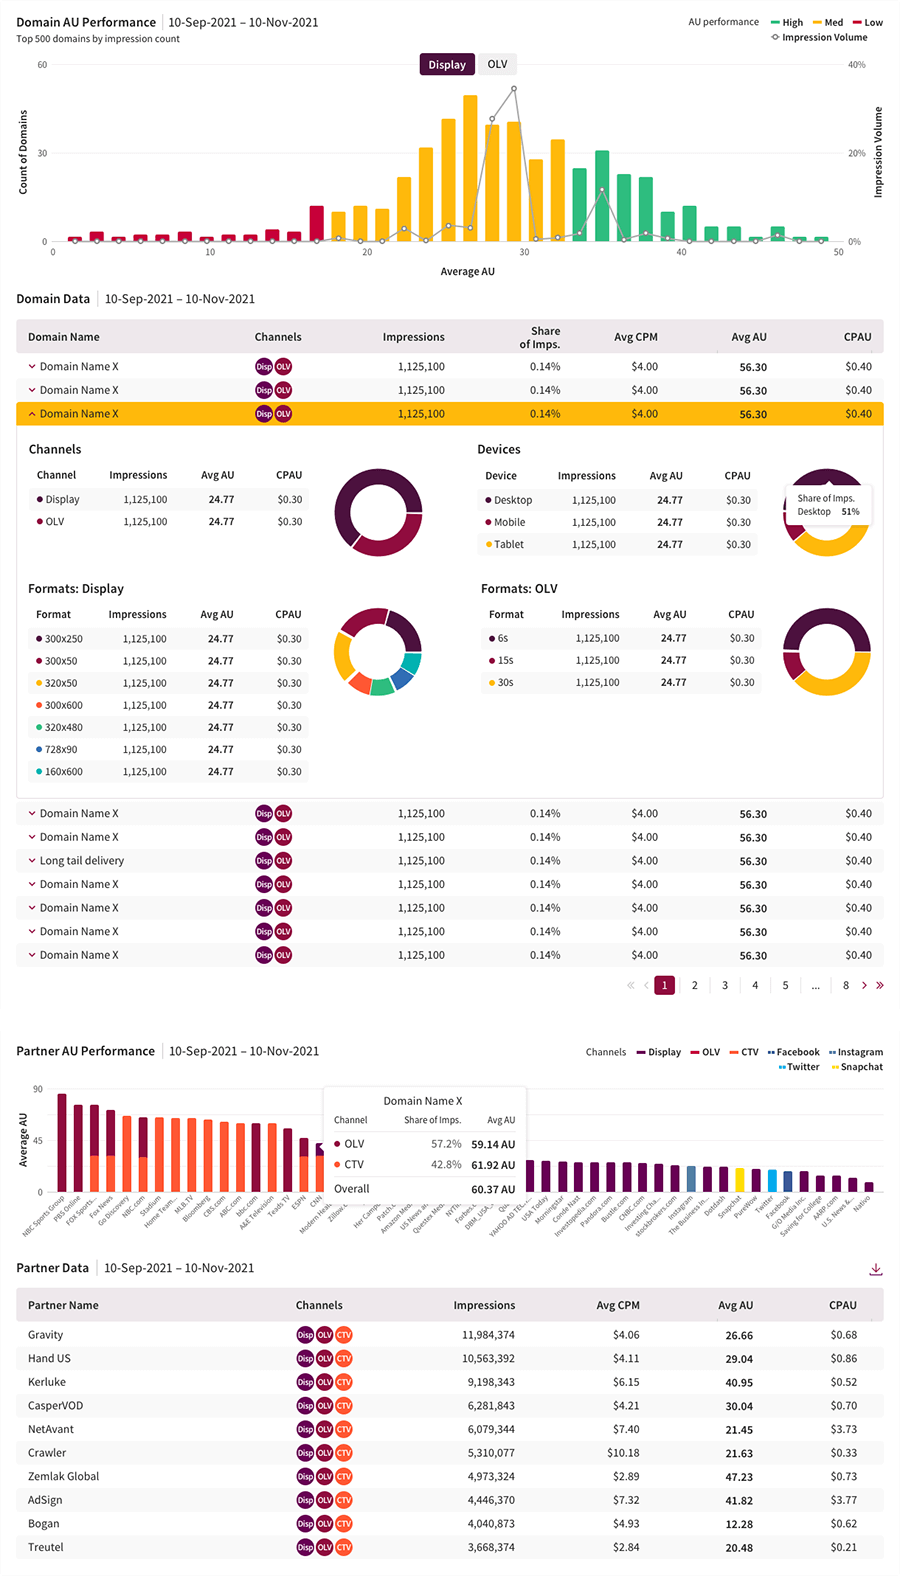
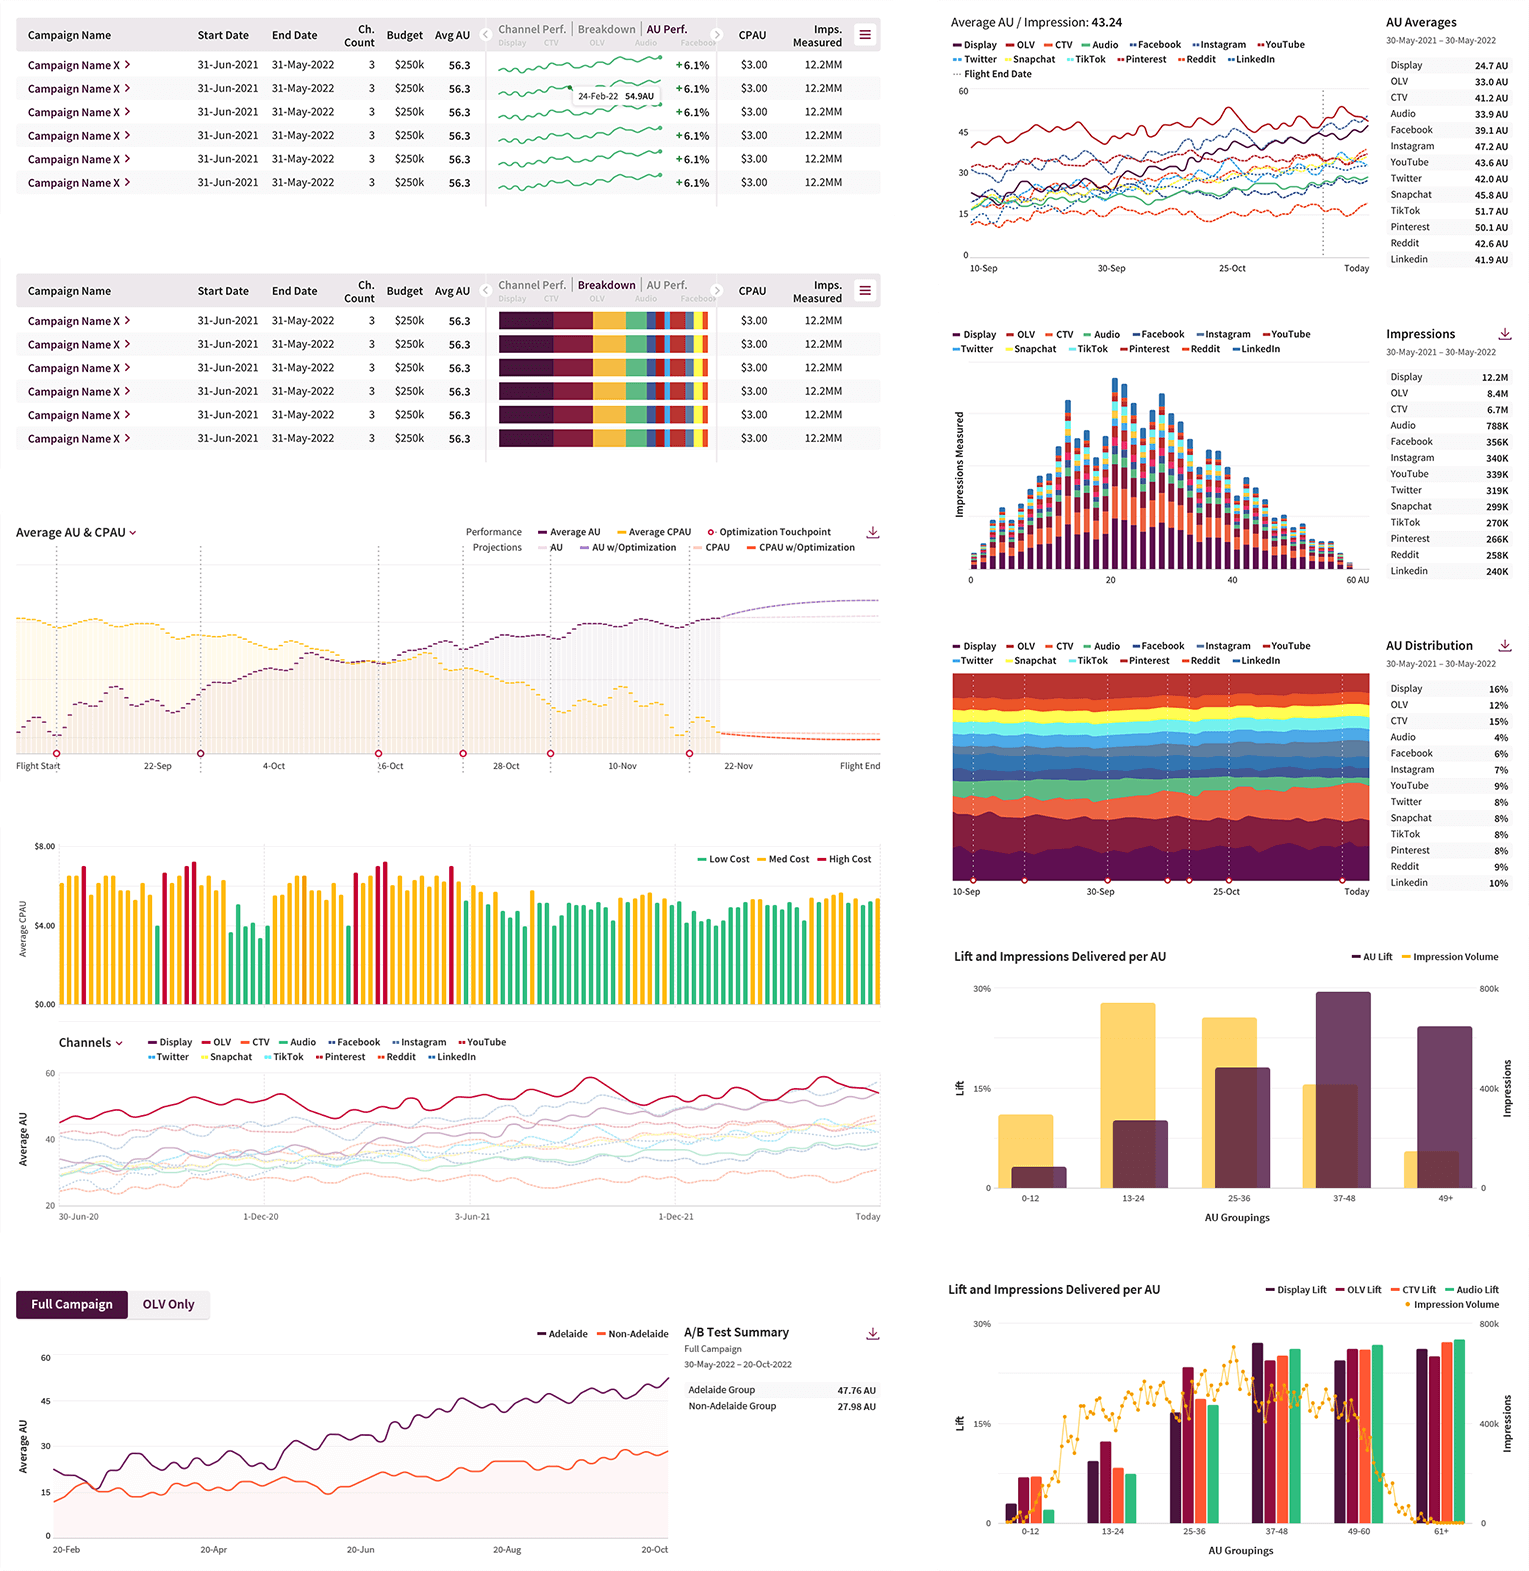
Campaign View
The Campaign view is the core of the application, providing campaign health data and granular insights broken out by Channel, Partner, Domain, Ad Format, Device, and Placement. All chart and table data is directly downloadable as CSVs, and deeper insights and actions are available through tooltips and nested tools.
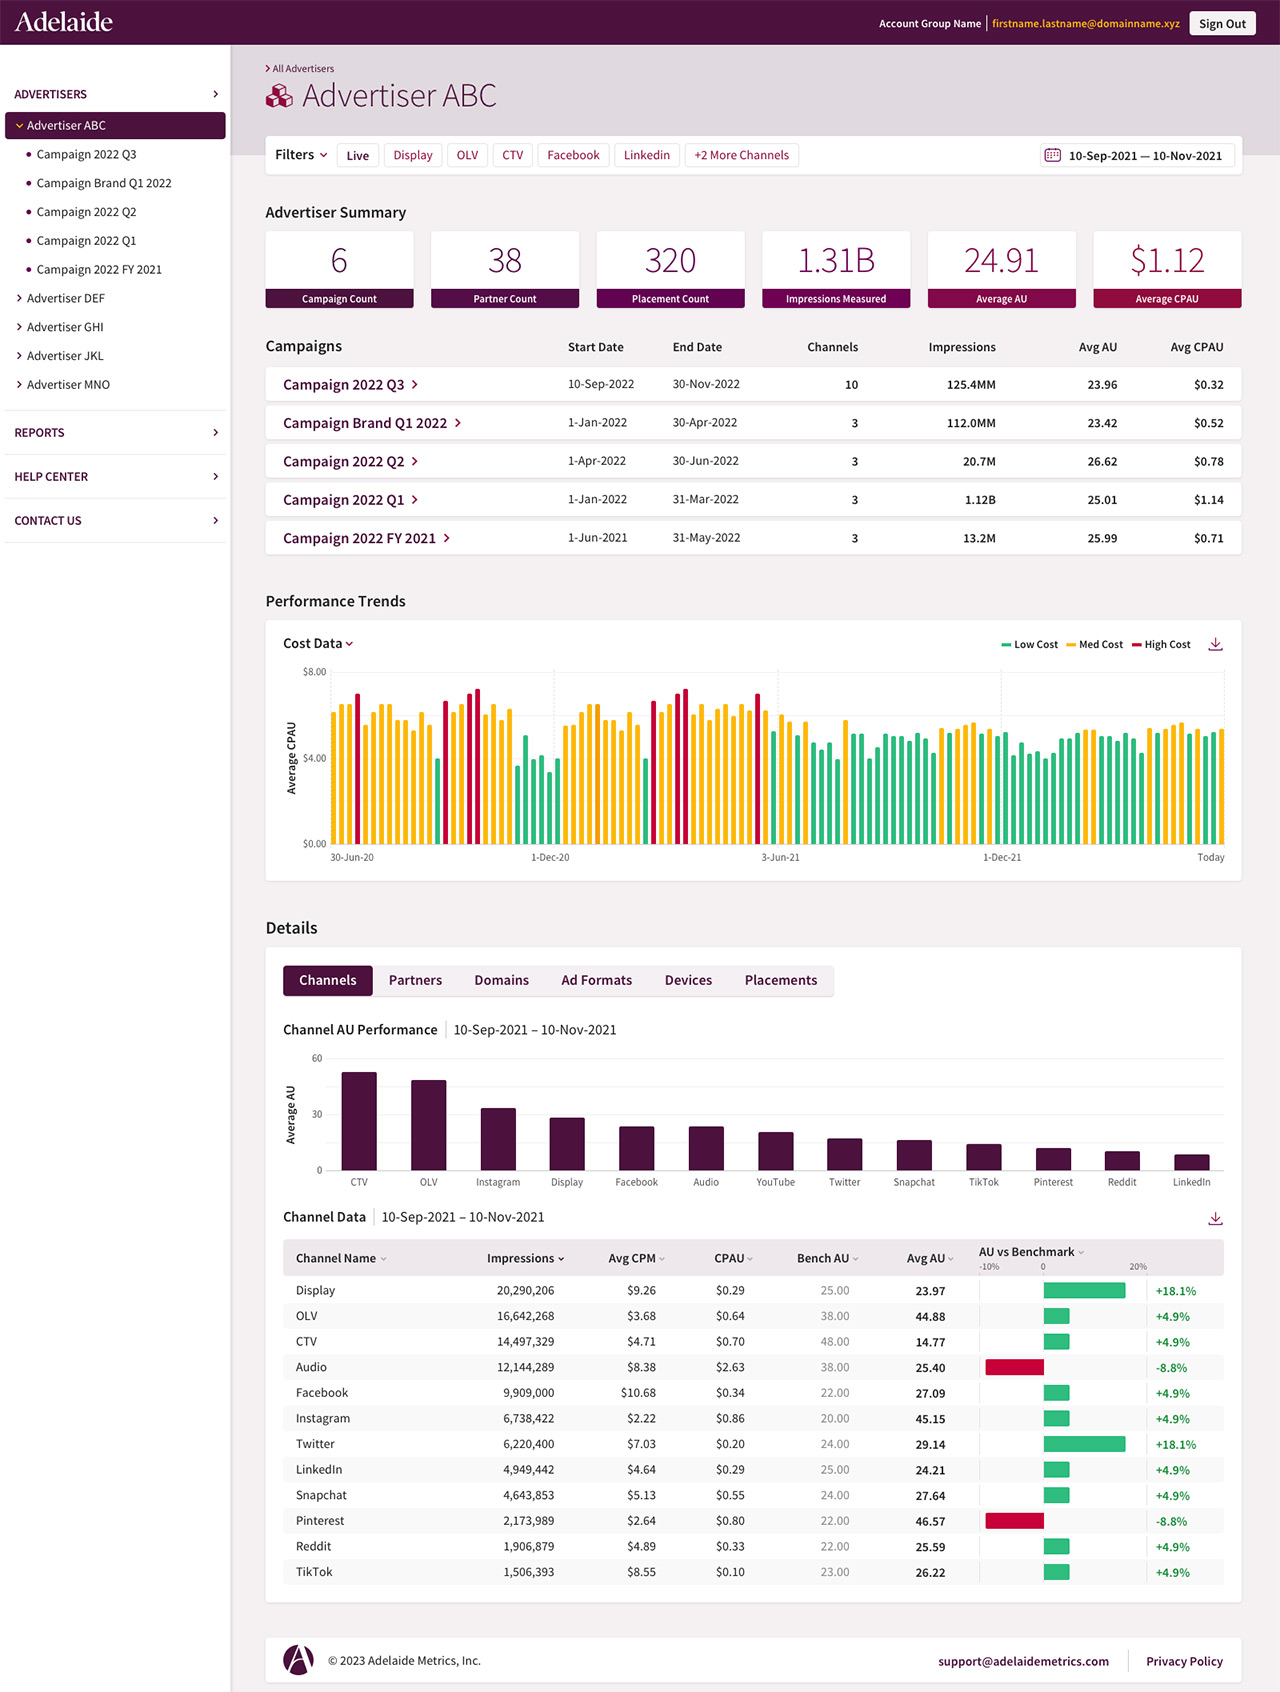
Advertiser View
The Advertiser view provides a jumping-off point for accounts with multiple campaigns and both aggregate and campaign-to-campaign level summary stats.
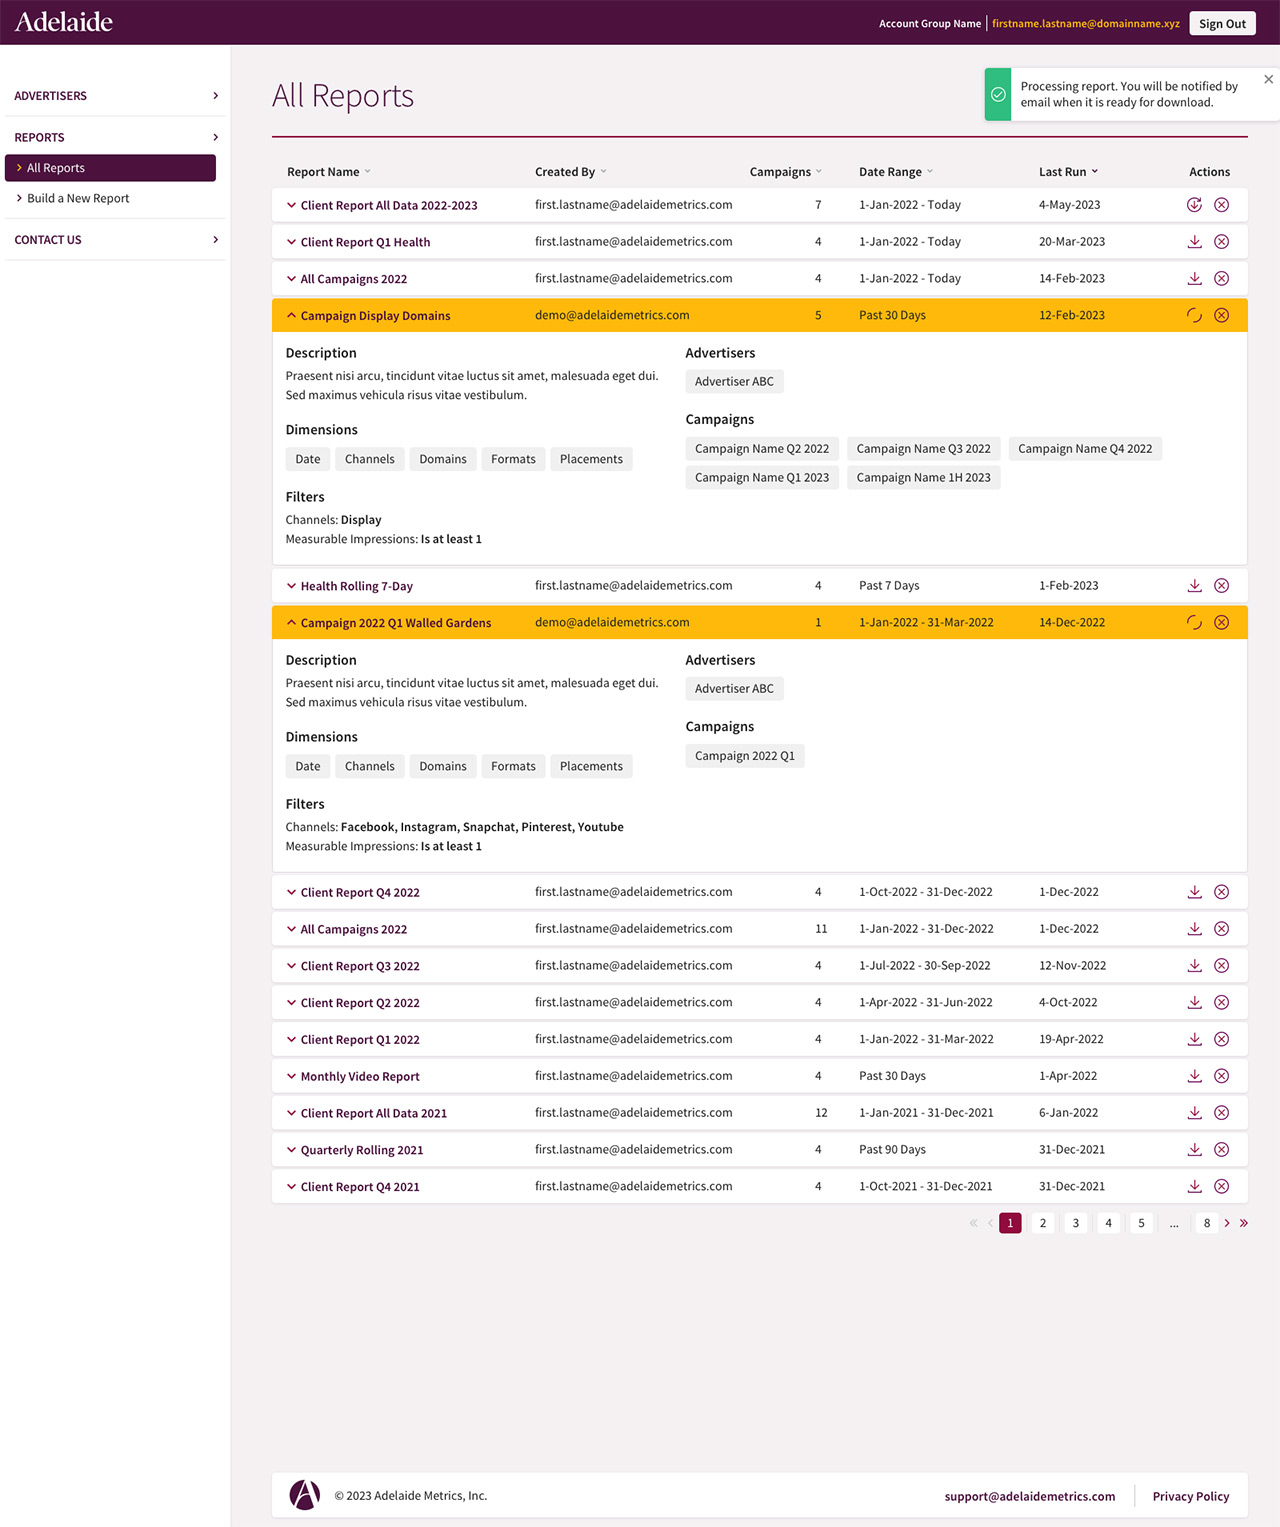
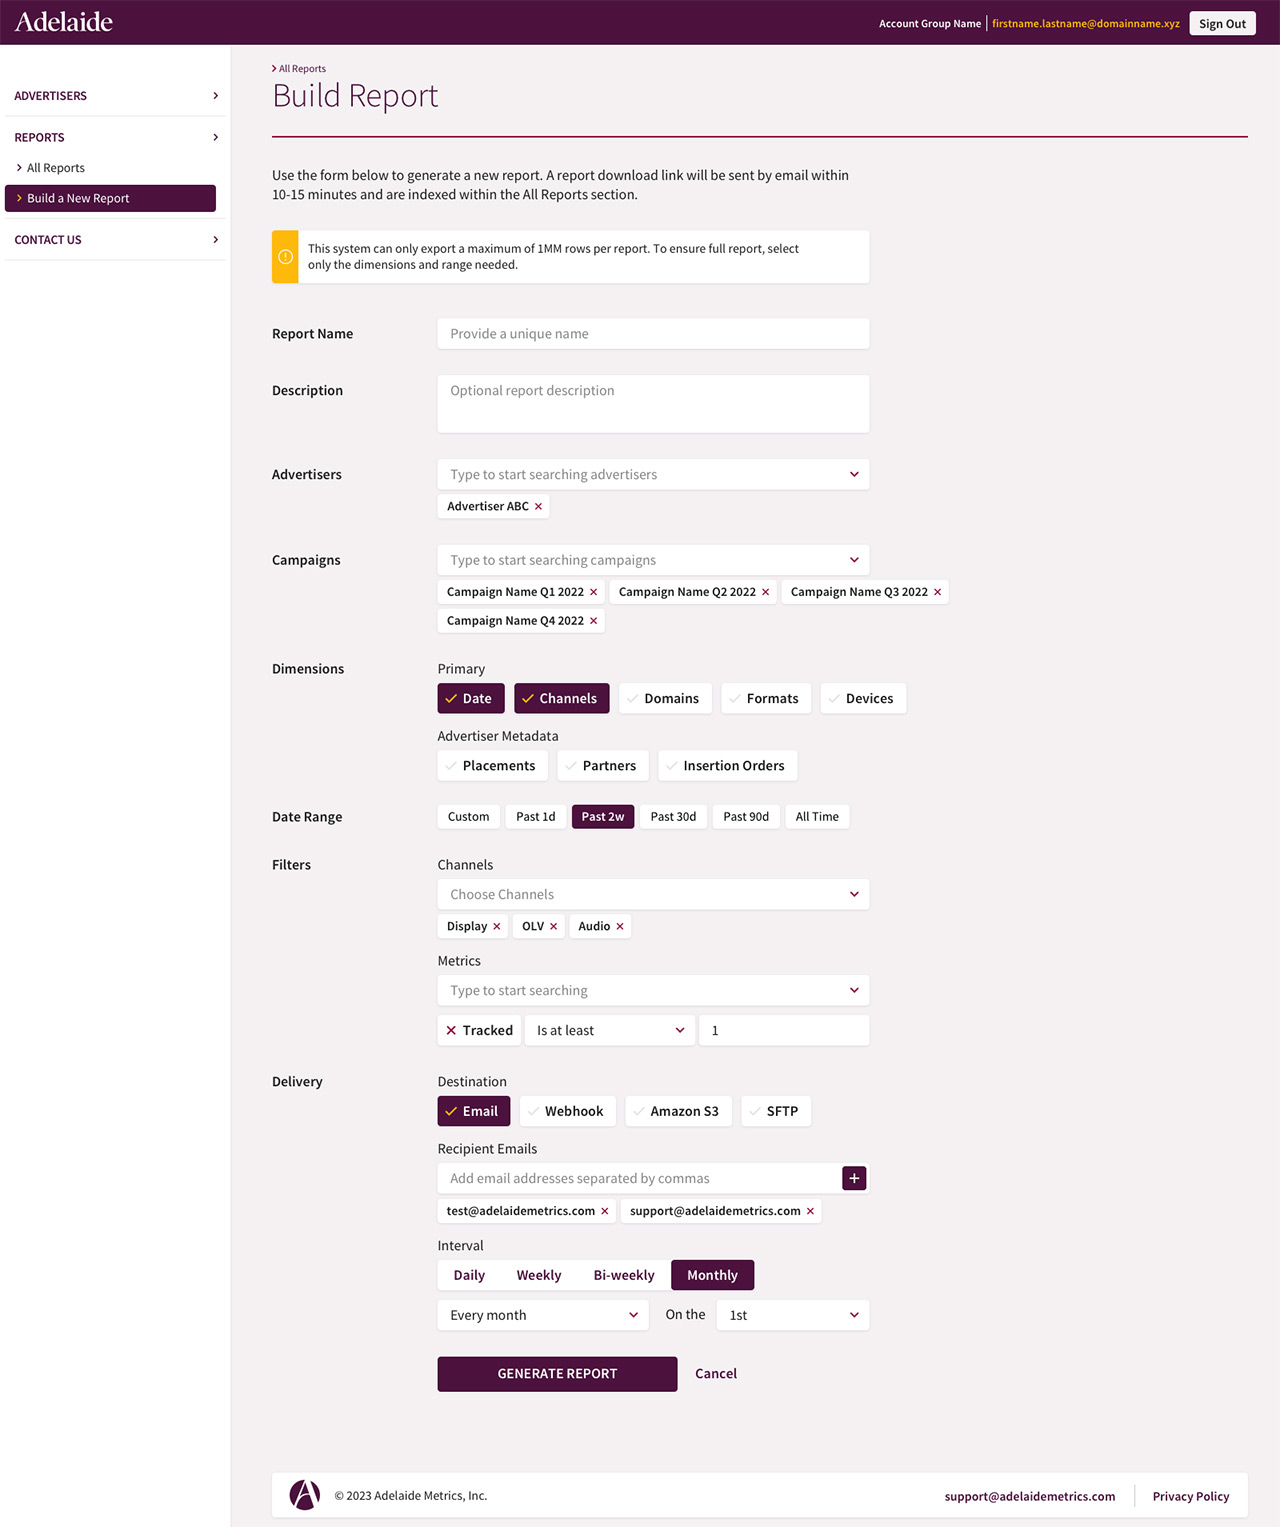
Custom Reports
The Custom Report tool provides users with a self-guided report generator to build scheduled, email-deliverable CSV reports on specific campaigns, dimensions, and date ranges. This tool is a window to the full Adelaide campaign database to provide custom cuts that are not otherwise visualized in the dashboard.
Charts
Developed with D3 in React (via Recharts), I had planned and built many iterations of chart visuals to help users gain the most relevant insights at a glance and make informed decisions to optimize their campaigns.
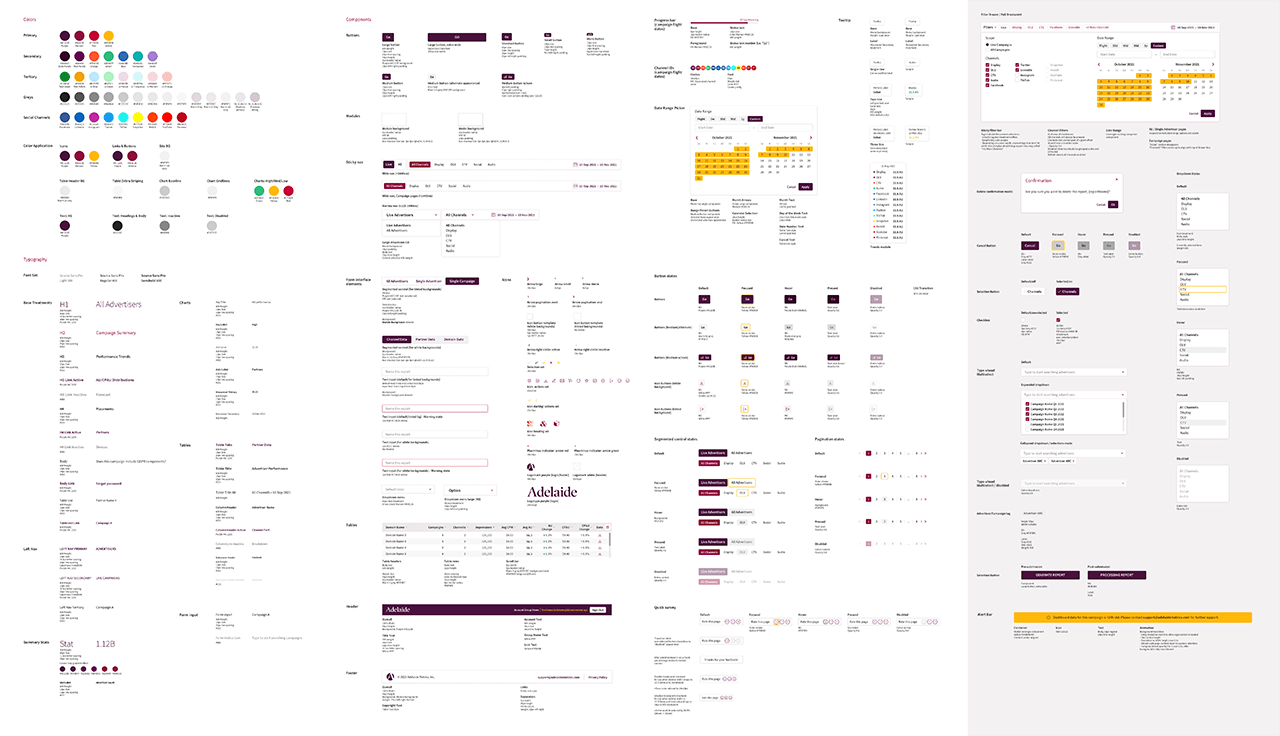
Style Guide
The style guide is spec sheet of colors, fonts, icons, and interface element states and behaviors to guide React component development.
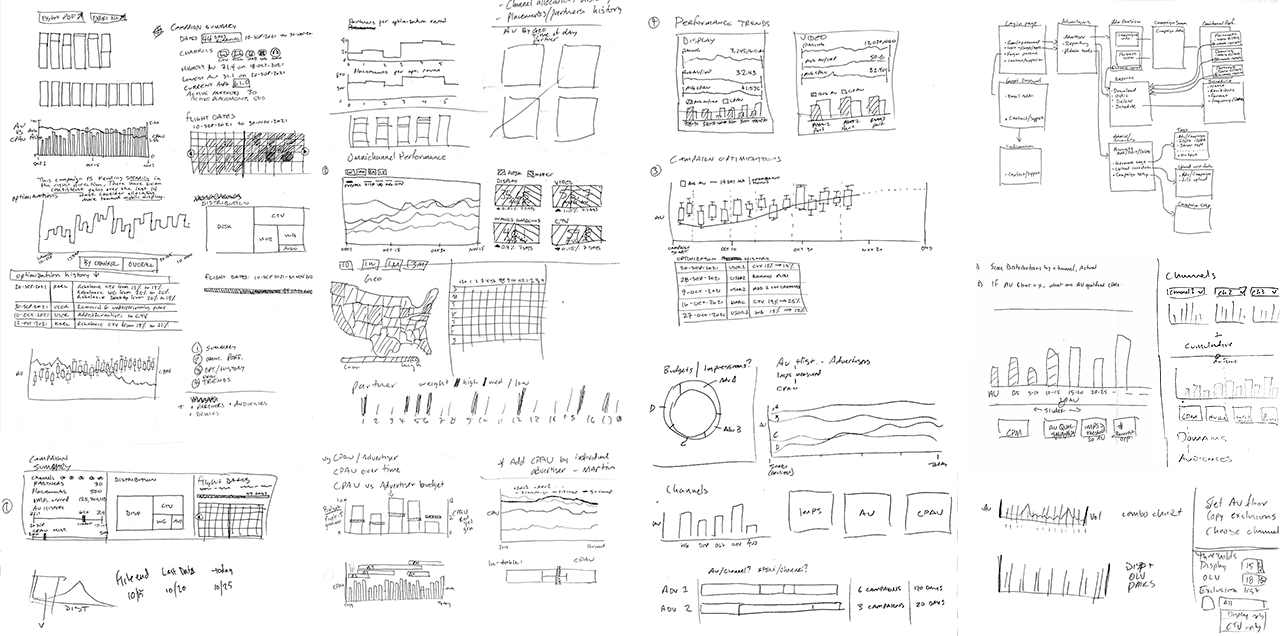
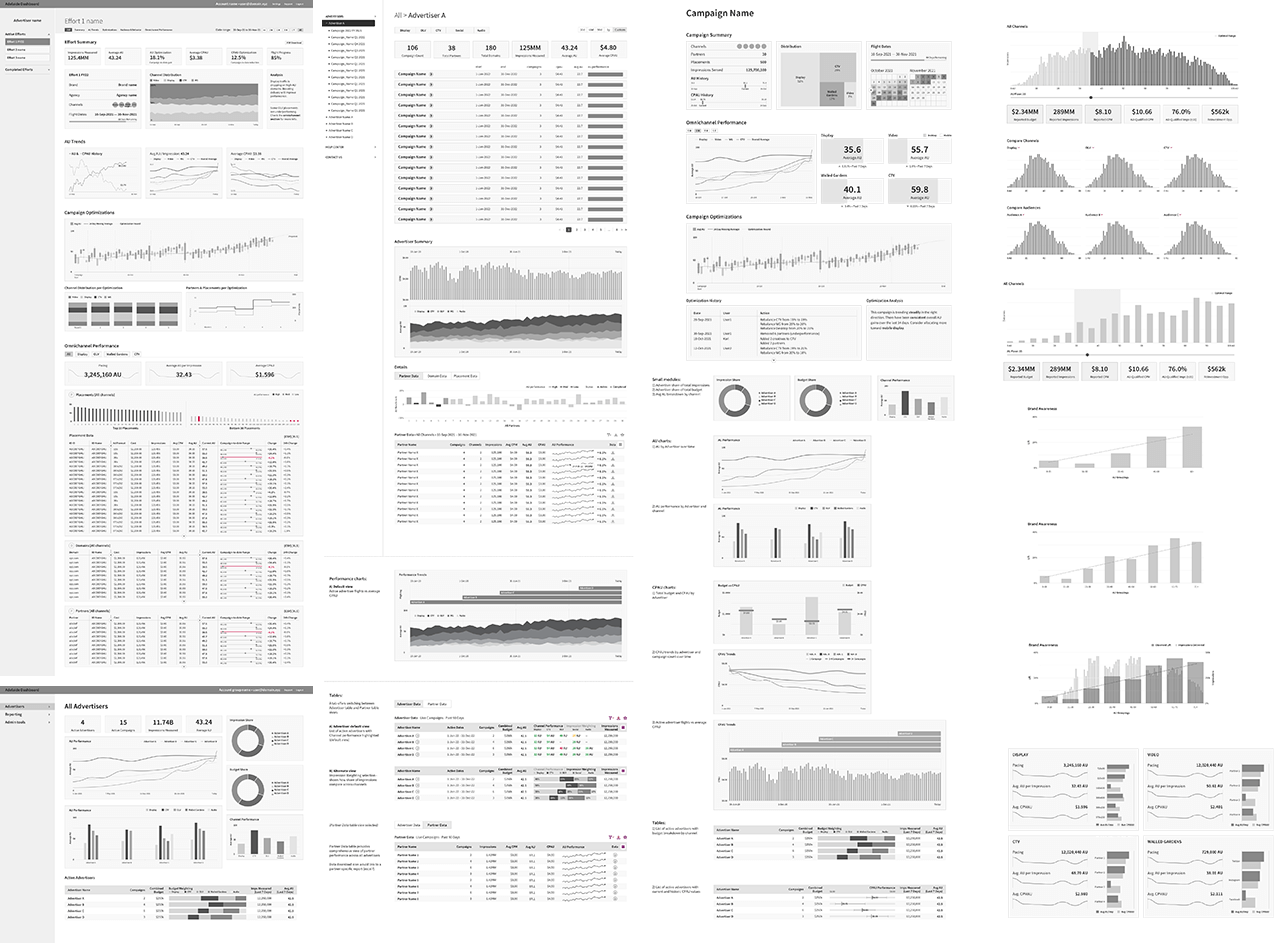
Sketches & Wireframes
From pencil and paper to Keynote, Lucidchart, and Sketch, dashboard foundational planning, layouts, features, and visualizations went through countless iterations of lo-fi sketches and wireframing.